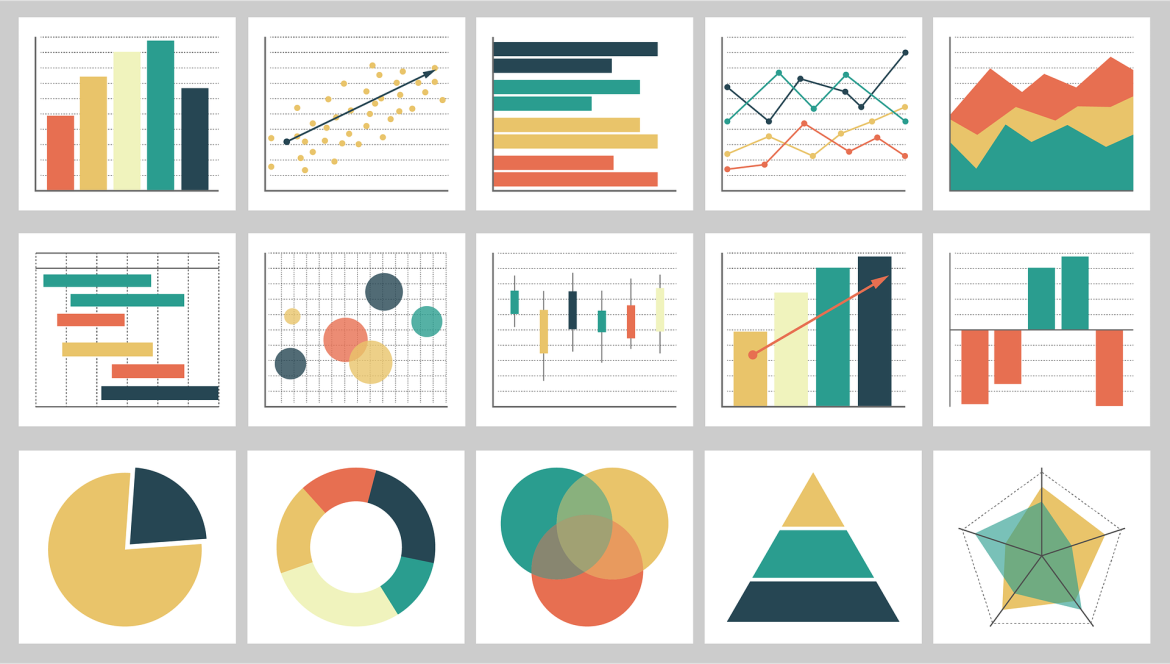
Hey there, fellow programmers! I wanted to share with you all the many benefits of using Tableau for data visualization. I know some of you may be thinking, “But I can create visualizations on my own, why do I need this software?” Trust me, Tableau is so much more than just a basic data visualization tool. It’s a game-changer that can take your programming skills to the next level.
Tableau is fancy-schmancy data visualization software that’s been making waves in the programming world. And let me tell you, it’s a real game-changer. Tableau is a data visualization tool that allows you to you turn numbers and figures into some beautiful, informational and interactive charts, graphs, and dashboards.
Tips for Using Tableau Software for Beginners
One of the best things about Tableau is the wide variety of shortcuts that are available to users, which can greatly speed up their workflow and make the experience of using the software much more efficient.
First and foremost, let’s talk about navigating the interface. You can use the Ctrl+T key combination to quickly create a new worksheet, while the Ctrl+W key combination will close the current worksheet. To switch between worksheets, you can use the Ctrl+Tab key combination to cycle through them, or you can use the Ctrl+Shift+T key combination to open a specific worksheet by name. You can also use the Ctrl+E key combination to export the current view as an image, and the Ctrl+Shift+E key combination to export the entire workbook.
As you start to create visualizations, you’ll notice that Tableau has a built-in programming language called “Calculated Fields” that allows you to perform calculations on your data. This means you can write code right inside Tableau and create custom visualizations tailored to your specific needs. To create a calculated field, simply right-click on a blank area in the Data pane and select “Create Calculated Field.” You can use the Ctrl+Shift+C key combination to create a new calculated field, and the Ctrl+Alt+C key combination to edit an existing calculated field.
When it comes to working with charts and graphs in Tableau, there are a variety of shortcuts that can help you quickly customize and format your visualizations. For example, you can use the Ctrl+Shift+1 key combination to switch to the “Sheet” tab, which allows you to format the overall look and feel of your worksheet. You can also use the Ctrl+Shift+2 key combination to switch to the “Marks” tab, which allows you to customize the appearance of individual data points in your visualization.
There’s also another feature in Tableau called filters, which allow you to narrow down your data to specific subsets. You can use the Ctrl+Shift+F key shortcut to create a new filter, and the Ctrl+Alt+F key combination to edit an existing filter. Once you have created a filter, you can use the Ctrl+Shift+R key combination to quickly apply it to your worksheet, and the Ctrl+Alt+R key combination to remove it.
Getting Tableau Assignment Help
While using Tableau for doing data visualization is not complicated, it is in fact time consuming. For example, when I was student at the university I knew exactly how to use Tableau for doing my homework but it was time consuming and I needed that time to focus on other critical tasks and meet some deadlines, So I found out that getting Tableau homework help was the best solution.
It has really saved me a lot of my time and I could meet my deadlines. Therefore, I always recommend to everyone who is getting into data science and data visualization to get Tableau assignment help when he needs it.
Conclusion
In conclusion, Tableau is a powerful data visualization tool that’s great for beginners. It makes connecting to data sources a breeze, offers a wide range of visualization capabilities, allows you to perform calculations on your data, and makes it easy to share your work with others. So don’t be afraid to dive in and start exploring your data with Tableau!

